

The dashboard has recently undergone significant updates, now offering more detailed views of your data and enabling the display of custom graphs. These enhancements make the dashboard an incredibly powerful and versatile tool for visualizing and analyzing your data, providing you with deeper insights and greater control over your information.
1. Adding a new graph
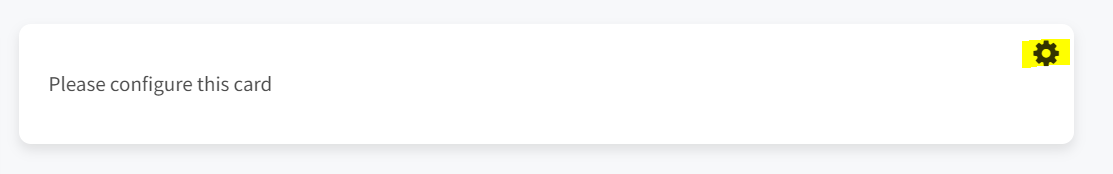
To add a new graph or replace an existing graph. Click on the cog icon
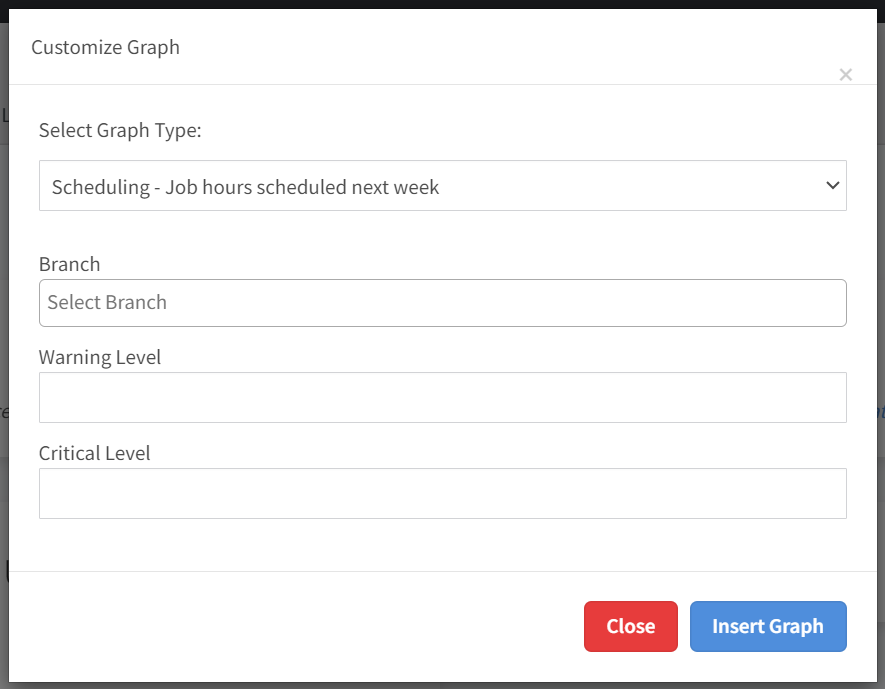
Fill out the Graph type and other parameters and click "Insert Graph"
Please note, some graphs are only available to Admin users.
2. Moving a graph
Simply click the heading and drag and drop the graph to the desired pane.
3. Copying the Dashboard to other users
Admin staff can set up a dashboard and copy that dashboard to other users.
To do this, set up the desired dashboard and click the "copy to other users" button. 
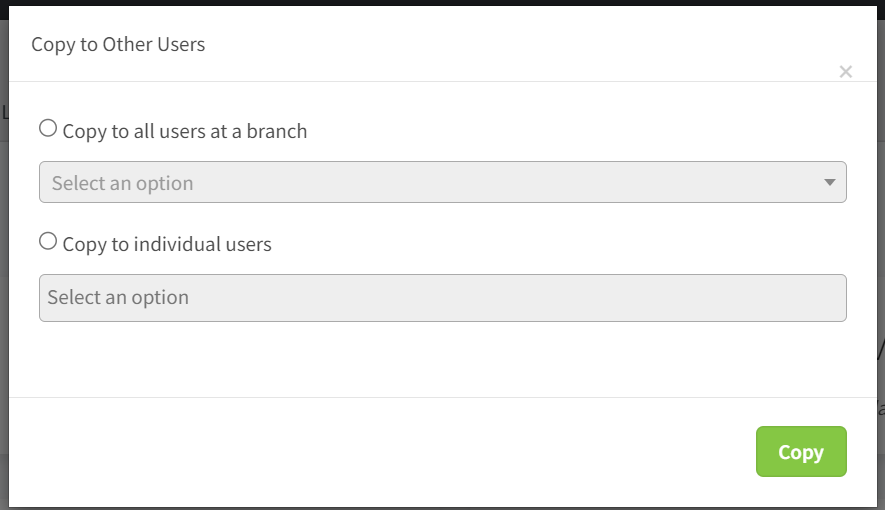
You can then either copy the graph to all users at a branch or specific users.
4. Explanation of Individual reports
| Name of Report | Description | Parameters |
| Jobs Not Approved | Displays the count of jobs that are complete but not approved. | Branch - The Branch this alert is for. Number of Grace days. - The number of days since completion before a job is included in this count. Warning Number of Jobs - Above this number of jobs the alert will display as orange. Critical number of jobs - Above this number of jobs the alert will display as red. |
| Technician Utilization this month | Displays each of the users assigned to a branch with their % Utilisation. This is based on the hours scheduled to that technician as a percentage of the hours to date for the month. For example if a tech is scheduled for 20 hours and we are at the end of the first week of the month, then their percentage will be 50% | Branch - The branch this graph is for Alert Level - The percentage under which this technician will appear as red. For example 80%. |
| Scheduling - Job Hours scheduled next week. | Displays the number of hours of jobs scheduled next week. | Branch - The branch this alert is for Warning Level - If the number of hours is less than this, the alert will display as orange Critical Level - If the number of hours is less than this, the alert will display as red. |
| Scheduling - Job Hours scheduled next 5 weeks | Displays the number of hours scheduled for the assigned branch for each of the next 5 weeks. | Branch - The branch this alert is for Warning Level - If the number of hours is less than this, the alert will display as orange Critical Level - If the number of hours is less than this, the alert will display as red. |
| Scheduling - Job Hours by Technician per week | Displays the number of hours scheduled for the selected users in the selected week | Branch - The branch this graph is for. Users - The users to display on this graph. Warning Level - If the number of hours is less than this, the alert will display as orange Critical Level - If the number of hours is less than this, the alert will display as red. Week Number - Which week from Today to display this information for. For example, 0 is this week. 1 is next week. |
| User Report - Job hours scheduled next 5 weeks to you | Displays hour many hours are scheduled to your login in each of the next 5 weeks. | Warning Level - Under this number of hours the alert will appear orange. |
| User Report - Jobs not approved | This shows the number of jobs assigned to you that are complete but not approved. | Branch - The branch this alert is for Warning Level - If the number of hours is less than this, the alert will display as orange Critical Level - If the number of hours is less than this, the alert will display as red. |
| User Report - Active Jobs | This shows the number of Active jobs assigned to you. |